Let's continue using the example of retrieving fabric endpoints by accomplishing the same functionality in JavaScript. This will provide a better interface to work with, show how to display the data, and use libraries to provide a way to manipulate it.
We had talked previously about the classQuery when we did the first request call in Python. The ACI system works the same across languages so you will be calling the same classQuery from JavaScript. The following diagram provides a visual cue on to the difference between a class query and a distinguished name.
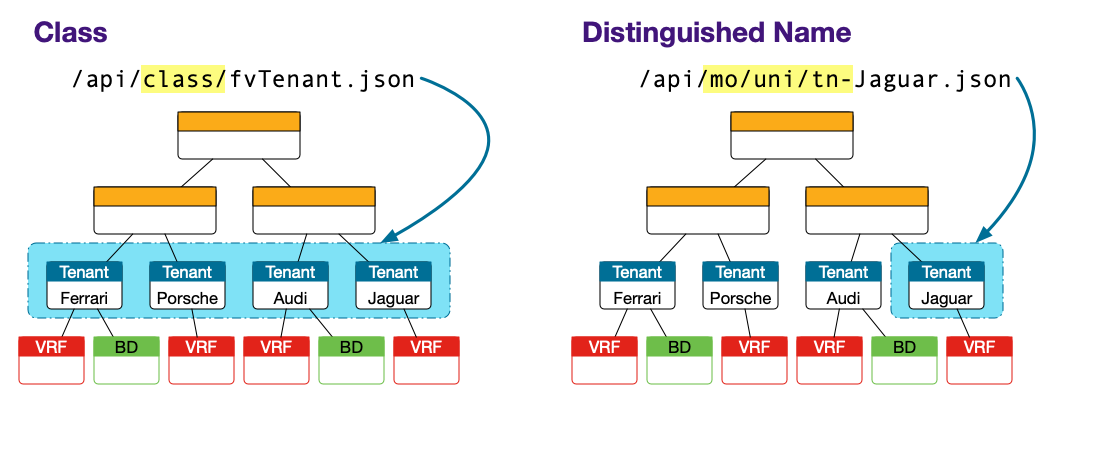
If you recall from the previous discussion, each object in the ACI Management Information Tree (MIT) belongs to a specific class. For example, LLDP neighbors has an object to define what an LLDP neighbor looks like. Endpoints, access ports, trunk ports, OSPF neighbors all have a class definition also. For this reason when you do a query towards the class, the fabric will return all the objects that are of that class in the fabric. For this reason class queries can also be done with filters to handle specific lookups ( for example, all the endpoints that belong to a particular Tenant)
The class fvCEp is used to find
learned endpoints in the fabric. In the request section a URL was built for
the specific class, request_url = '/node/class/fvCEp.json'.
Since class queries always use the same base URL structure /api/node/class/,
a function can be built to execute the request for given a specific class
and return the data for processing. Don't forget the classQuery()
function must utilize the tokens to authenticate.
var creds = {
  url: 'https://10.0.226.41',
  name: 'aciproglab04',
  pwd: 'cisco.123',
  token: '',
  urlToken: ''
}

function classQuery(classname) {
  return $.ajax({
    url: creds.url + '/api/node/class/' + classname + '.json',
    headers: {
      'DevCookie': creds.token,
      'APIC-challenge': creds.urlToken,
      'Content-Type': 'application/json'
    }
  });
};


function login() {
  return $.ajax({
    type: 'POST',
    url: creds.url + '/api/aaaLogin.json?gui-token-request=yes',
    data: JSON.stringify({
      aaaUser: {
        attributes: {
          name: creds.name,
          pwd: creds.pwd
        }
      }
    }),
  });
};

$( document ).ready(function() {
  login().then(function (data) {
    var attrs = data['imdata'][0]['aaaLogin']['attributes'];
    creds.token = attrs['token'];
    creds.urlToken = attrs['urlToken'];
  });
});
Call the classQuery() function in document.ready().
Specifically, within the callback function passed into login().then().
Then, create the endpoints variable outside of the document.ready()
invocation. This will play a role in showing you around Chrome's Developer Tools.
var creds = {
  url: 'https://10.0.226.41',
  name: 'aciproglab04',
  pwd: 'cisco.123',
  token: '',
  urlToken: ''
}

var endpoints = {};

function classQuery(classname) {
  return $.ajax({
    url: creds.url + '/api/node/class/' + classname + '.json',
    headers: {
      'DevCookie': creds.token,
      'APIC-challenge': creds.urlToken,
      'Content-Type': 'application/json'
    }
  });
};


function login() {
  return $.ajax({
    type: 'POST',
    url: creds.url + '/api/aaaLogin.json?gui-token-request=yes',
    data: JSON.stringify({
      aaaUser: {
        attributes: {
          name: creds.name,
          pwd: creds.pwd
        }
      }
    }),
  });
};

$( document ).ready(function() {
  login().then(function (data) {
    var attrs = data['imdata'][0]['aaaLogin']['attributes'];
    creds.token = attrs['token'];
    creds.urlToken = attrs['urlToken'];

    classQuery('fvCEp').then(function (data) {
      endpoints = data['imdata'];    // endpoints is an array of objects
      console.log('Total # of endpoints: ' + endpoints.length);
    });

  });
});
Since JavaScript is a client side programing language, the debugger is
located on the browser which interfaces with the client. Previously, you were
shown how to use the console.log() JavaScript function to print
log output. While this is useful, a more useful tool is available in the browser console.
To activate the console right click on the page and select Inspect from the Menu or
use the keyboard shortcut Ctrl+Shift+i. Then hit the
reload button on the browser. You should see something
similar to the following.
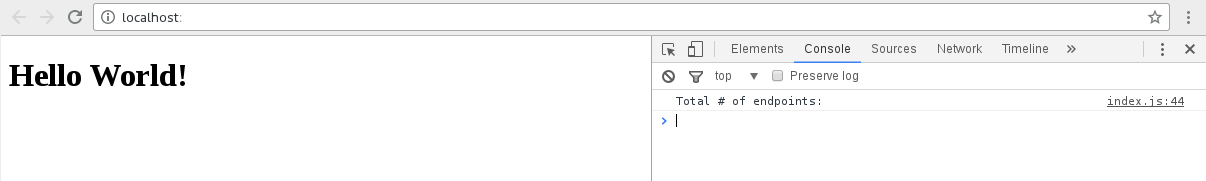
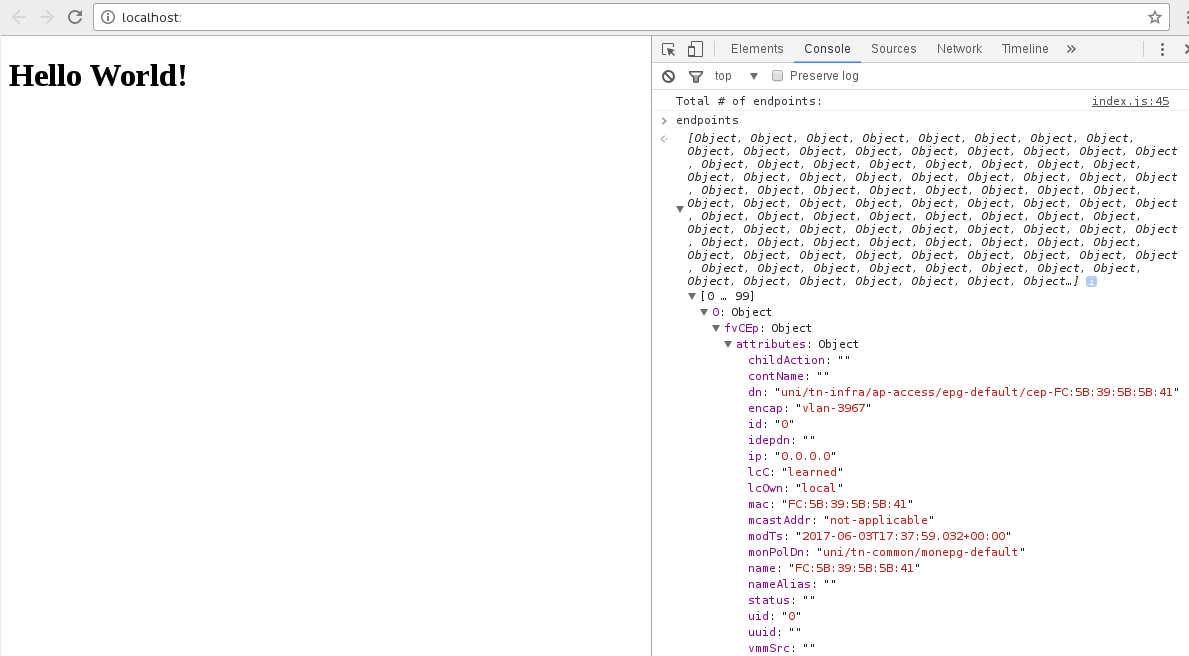
In the console, there should be a cursor for input under the Total # of endpoints:
line. Type creds and press enter
Elements Console Sources Network
      > creds
      {url: 'https://10.0.226.41', name: 'aciproglab04', pwd: 'cisco.123', token: 'eyJhbGciOiJSUzI1NiIsImtpZCI6ImZrdTJsanNwcmlza24wd2…rKbJc-UQ_yQU2WdElj334-0SVQ6BjzTIgQcb-G8efeQSdcfag', urlToken: '6f63105e8db4d97c3f59d8957f152e4779ffb2757c2210934ef662947fd5867b'}
      name: "aciproglab04"
      pwd: "cisco.123"
      token: "eyJhbGciOiJSUzI1NiIsImtpZCI6ImZrdTJsanNwcmlza24wd2swNG9sbnYzeTdlaTl5cDFzIiwidHlwIjoiand0In0.eyJyYmFjIjpbeyJkb21haW4iOiJhY2lwcm9nbGFiMzAiLCJyb2xlc1IiOjAsInJvbGVzVyI6MTgzNTAwNH0seyJkb21haW4iOiJjb21tb24iLCJyb2xlc1IiOjE4MzUwMDQsInJvbGVzVyI6MH0seyJkb21haW4iOiJhbGwiLCJyb2xlc1IiOjE4MzUwMDUsInJvbGVzVyI6MH1dLCJpc3MiOiJBQ0kgQVBJQyIsInVzZXJuYW1lIjoiYWNpcHJvZ2xhYjMwIiwidXNlcmlkIjoxMjgyOCwidXNlcmZsYWdzIjoyLCJpYXQiOjE3MTc1ODUxMTgsImV4cCI6MTcxNzU4NTcxOCwic2Vzc2lvbmlkIjoiUFV4K0JsL0xUV09PUndnb2ZBemI1Zz09In0.BDe3hXDMh0E_AOHQyJtU04EVqVK3MGSvBT7qEoQ5QOi5TBoC0aES6iZxuCIcnSJAIA2OFn6gFgZM400cUxvuf9F9oXgoaHIwKVQ4-gXhAxb7nfbRE5TDkI5BbKCsjrhyXeiod2-20Umlimwsz0tMQiypk4goYXJDKWaTX2Dai5KvB8HSKbvy53rFewmbE8n_3BweBUHiYrU3DKahGwNBUcdXKKSpvrhU1XELtCd86A1XmwY1B-LZmvuYx6-9sT7XTs8m173aWiZCUFrNkhOt64deWunjTCmsB8i8-rKbJc-UQ_yQU2WdElj334-0SVQ6BjzTIgQcb-G8efeQSdcfag"
      url: "https://10.0.226.41"
      urlToken: "6f63105e8db4d97c3f59d8957f152e4779ffb2757c2210934ef662947fd5867b"
      [[Prototype]]: Object
As you can see, the credential object is displayed. If you were to repeat the command for the endpoint array that was built from the response from the fabric then output should contain all the endpoint data.
If you type endpoints in the chrome console then you would get to see the
whole object that is now stored in the browser window. You can expand the object and even
manipulate it.
Now that you have the data, let's take things up a notch and make them available easily to the end user.